Generating Interactive & Customized Reports
in the enDAQ Cloud


Get the exact data you need for actionable results, quickly and easily. 

New call-to-action


Visualize: Generate Powerful Interactive Reports 

Demonstration of enDAQ Cloud report generation feature

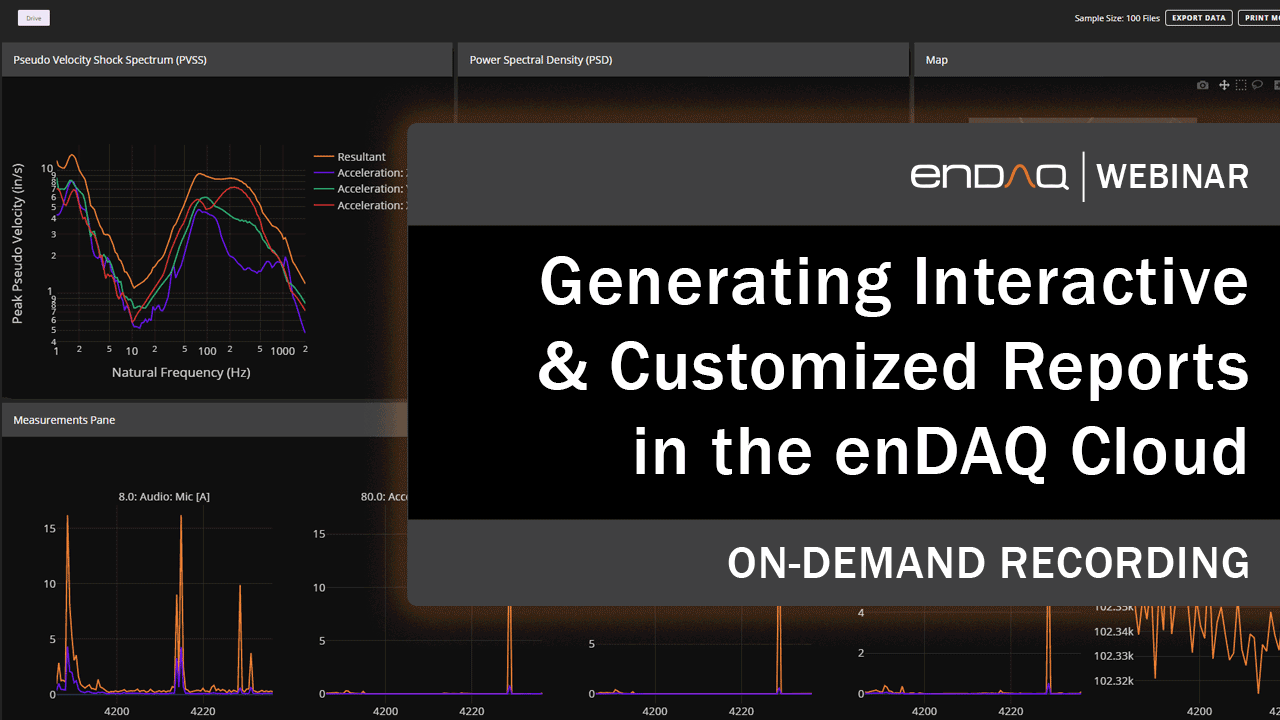
Analyze, Visualize and Generate Interactive & Customized Reports in the enDAQ Cloud:

  • Summarize test data into a customizable single page
  • Generate highly interactive, shareable reports
  • Use your own code to customize your reports (Starter, Professional, and Enterprise tiers)


If you're interested in getting a personalized demo to see how the enDAQ Cloud can benefit your application, book a demo with one of our engineers. 

Book an enDAQ Cloud Demo


Alerts: Monitor Your Environment and Assets


enDAQ-Cloud-Create-Alert

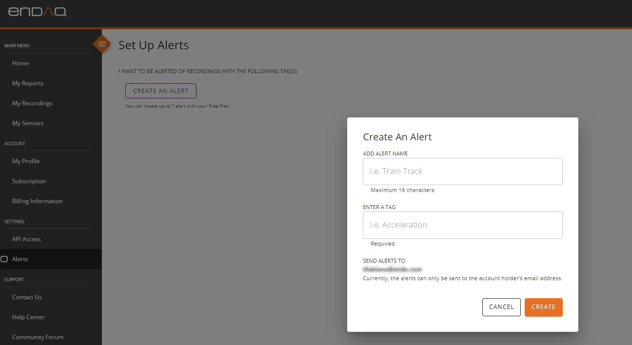
Set custom alerts based on your recorded data. Set up alerts for generic testing environments or warnings or alarms for condition-monitoring on assets.

  • Free membership: one custom alert
  • Starter tier: five custom alerts
  • Professional tier: unlimited custom alerts.


Analyze: Powerful Analysis Metrics


endaq-cloud-acceleration-time-historyAll membership options include the following advanced analysis metrics:

  • Acceleration RMS
  • Acceleration Peak
  • GPS Location
  • Microphone RMS
  • Gyroscope RMS
  • Temperature
  • Pressure
  • Pseudo Velocity Peak
  • Velocity RMS
  • Displacement RMS
  • Full PSD
  • Full PVSS


Pricing: Monthly and Annual Subscriptions


enDAQ Cloud subscription tiers


Go to the enDAQ Cloud Platform